[ad_1]

In wake of a month of explosive upside, “Bitcoin is consolidating above the on-chain cost-basis of several cohorts,” crypto analytics firm Glassnode said in their latest weekly on-chain newsletter. As a result, this has put “the average BTC holder into a regime of unrealized profit, and demonstrates a potential turning of the macro market tides is underway,” Glassnode claims.
One way of representing this return to profitability is via a 7-Day Exponential Moving Average (EMA) of Glassnode’s Realized Profit/Loss Ratio indicator. “We can observe the first sustained period of profitability since the Apr 2022 exit liquidity event, suggesting initial signs of a change in profitability regime,” says Glassnode referring to the chart.
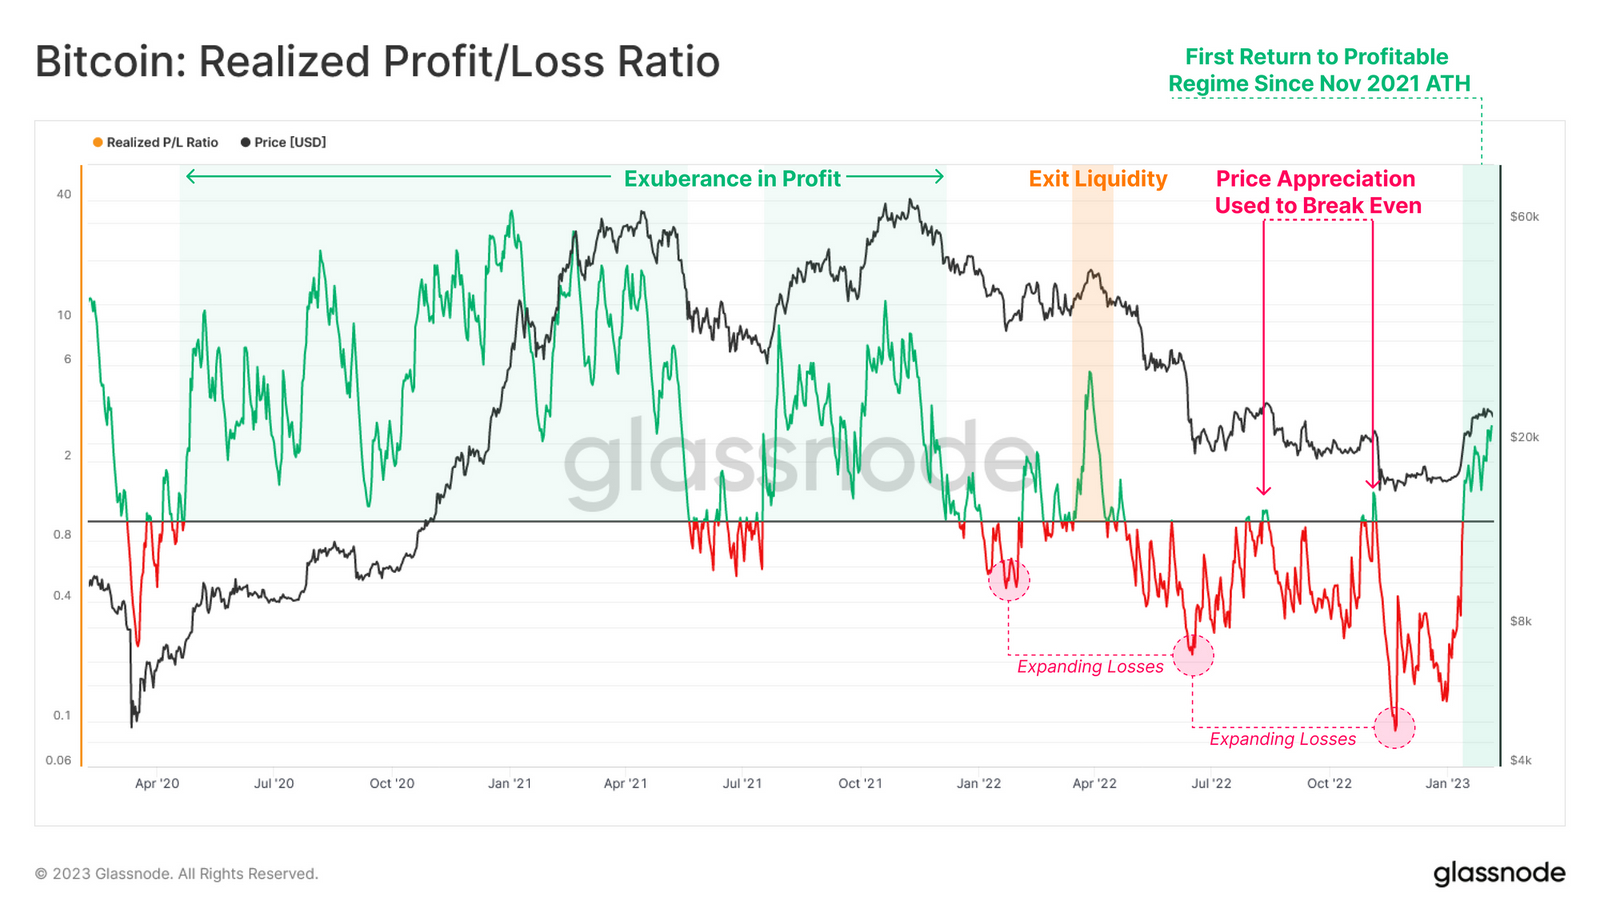
According to Glassnode, if the Realized P/L Ratio (7-Day EMA) falls back below 1.0 with prices at current levels, that would indicate a large increase in realized loss dominance, which could only happen if there was increased spending by investors who acquired their coins at a higher cost basis.
Unrealized Profitability Momentum Approaching a Key Point
Glassnode also highlights a second indicator that drives home a similar point. Glassnode’s Net Unrealized Profit/Loss Ratio (NUPL) “shows that the recent rally has launched the spot price of Bitcoin above the average acquisition price of the wider market,” they observe. “This puts the market back into a regime of unrealized profit, where the average holder is back in the green”.
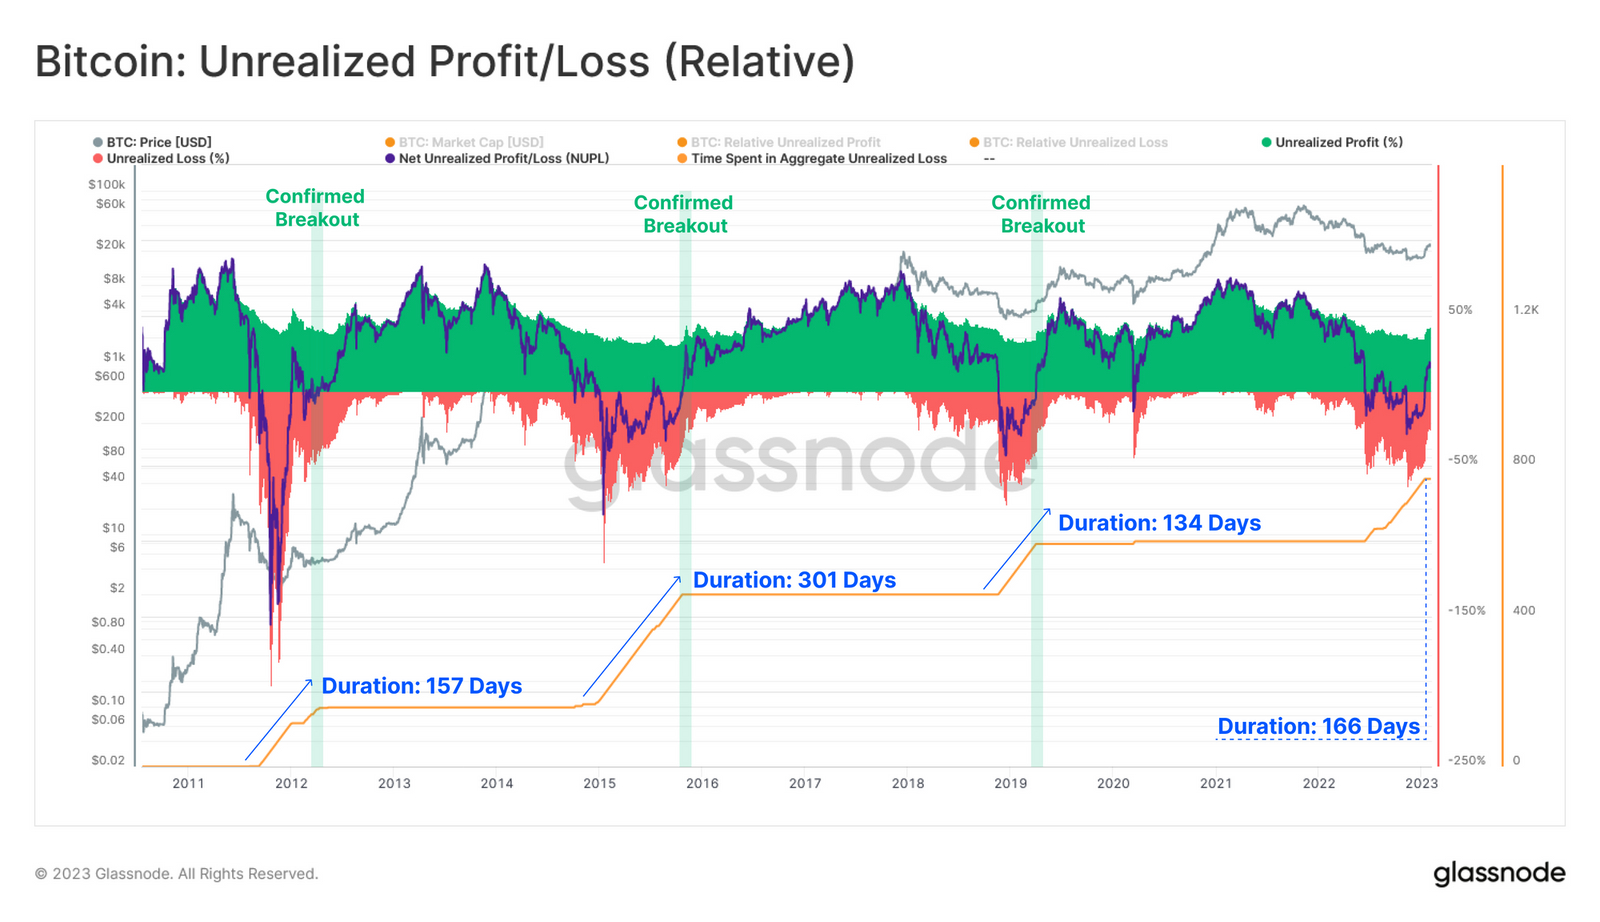
Glassnode notes historic similarities between the move recent market cycle and past bear market periods where the NUPL was negative for a prolonged period of time. The current cycle saw the NUPL turn negative for 166 days, while it was negative for 157 days in 2011-12 and for 134 days in 2018-19. However, that doesn’t mean the NUPL can’t stay negative for significantly longer – in 2015-16, it was negative for 301 days.
“The ratio between the total current unrealized profit held by the market and its yearly average can… provide a macro scale indicator for a recovering market,” Glassnode states, before presenting a new indicator called Relative Unrealized Profitability Momentum.
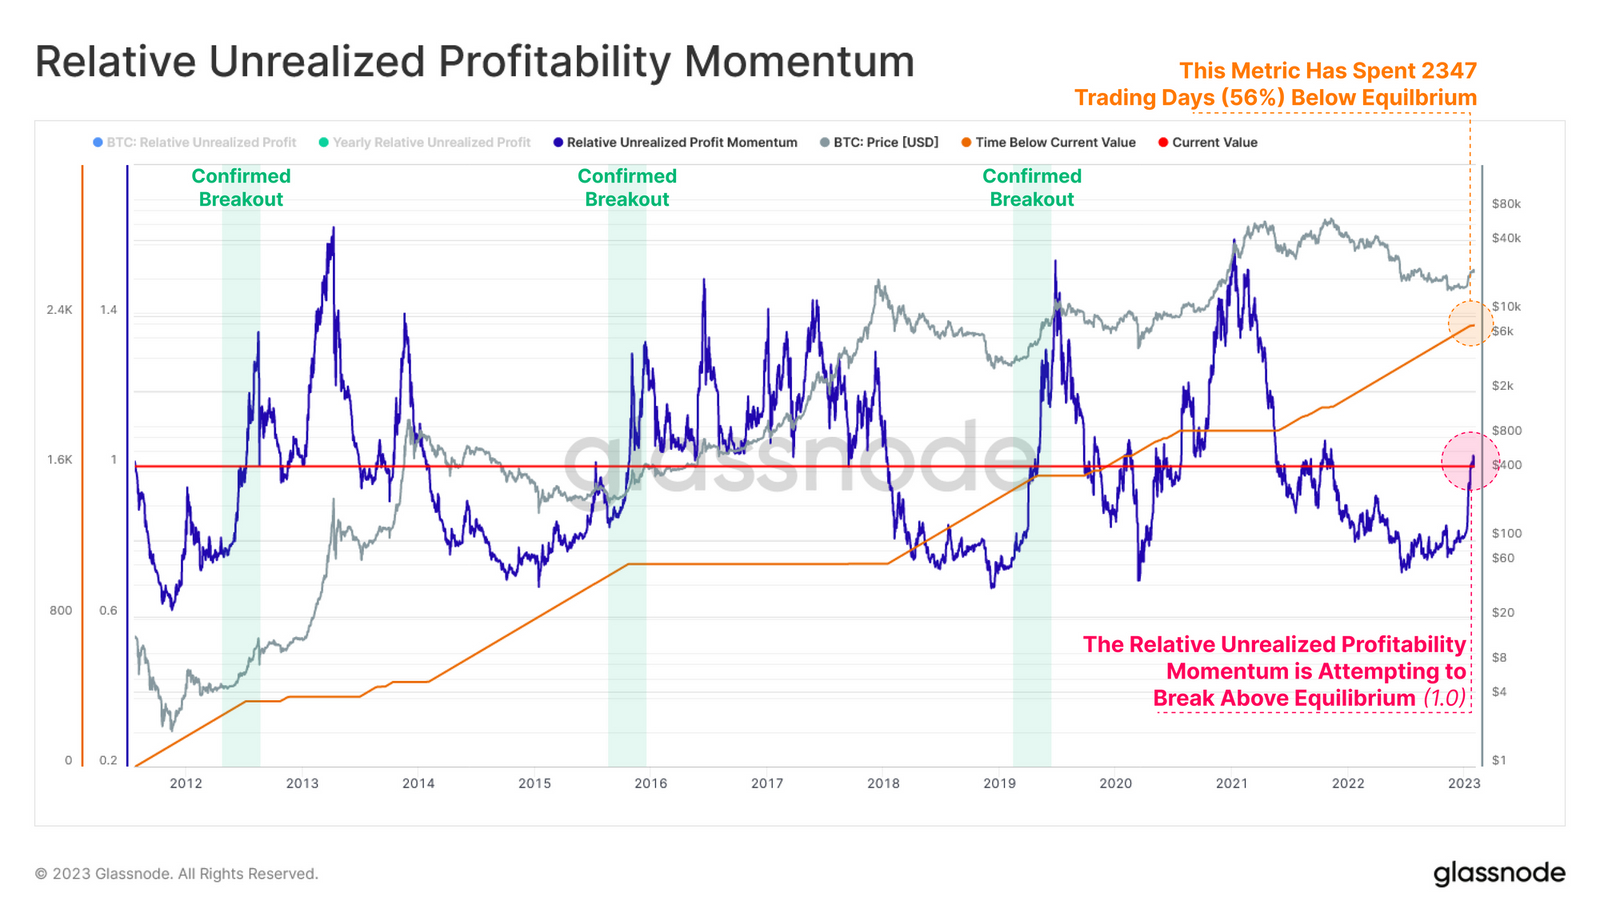
According to the crypto analytics firm, “this momentum metric is now approaching the equilibrium break point and bears similarity to the recoveries from the 2015 and 2018 bear market years”. Glassnode adds that “confirmed breakouts above this equilibrium point have historically coincided with a transition in macro market structure”.
HODLer Dominance Fading, Suggesting Capitulation Phase Over
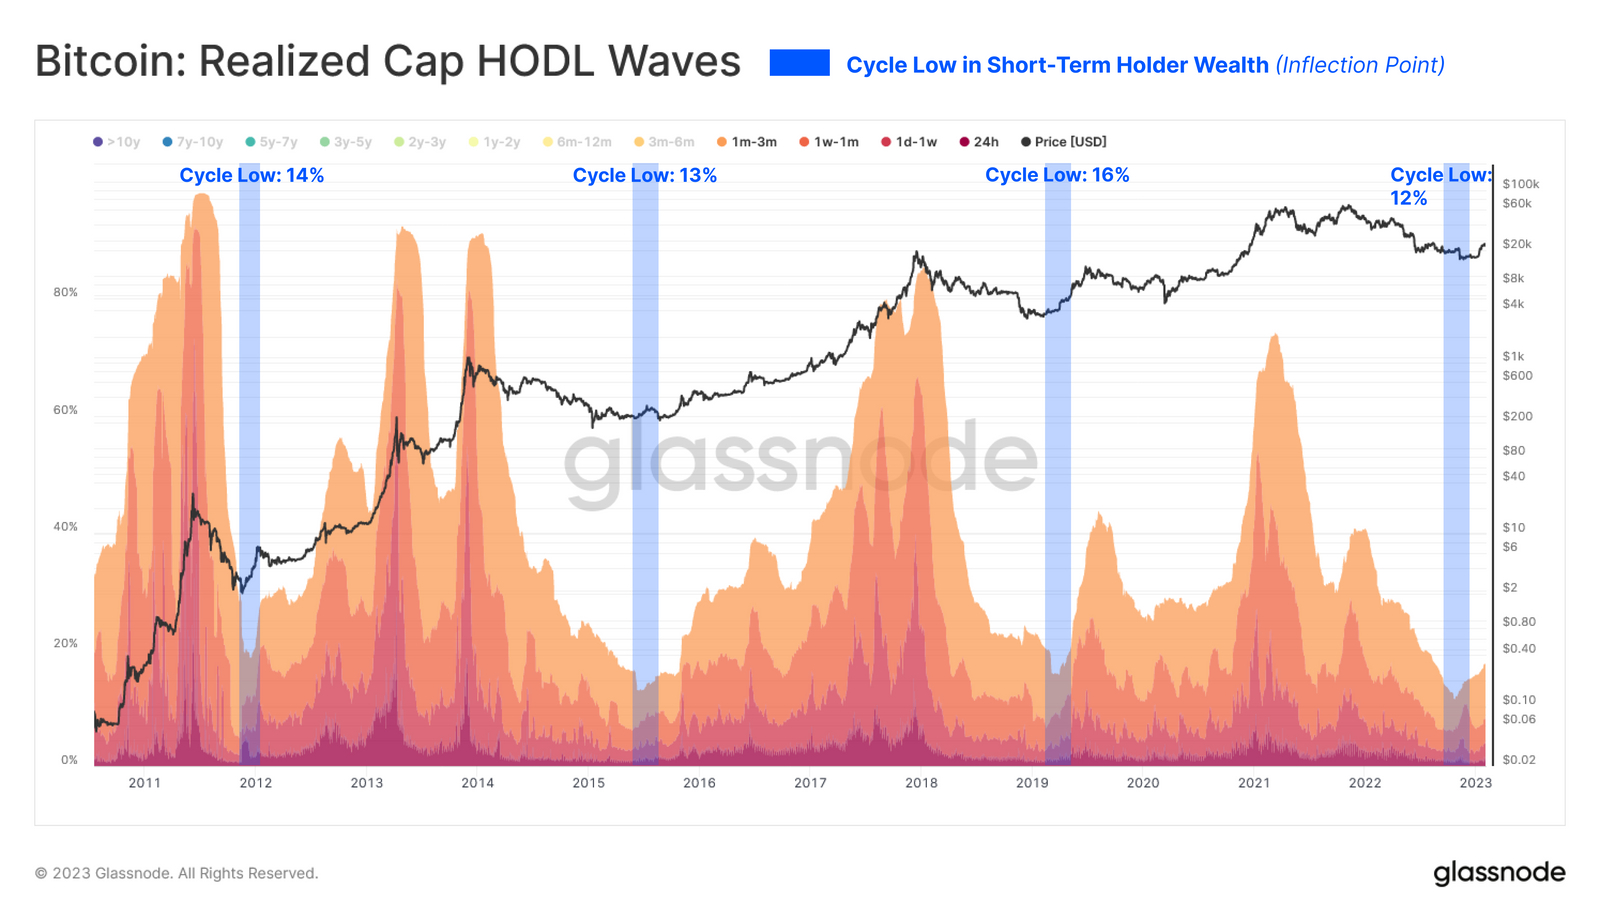
The recent price recovery in Bitcoin’s price and return to profitability for a majority of the Bitcoin market has coincided with a small but meaningful decline in the dominance of Bitcoin HOLDers. That can be demonstrated via Glassnode’s Realized Cap HODL Wave chart, which shows the percentage of Bitcoins that last moved less than three-month lows having recently recovered a few percent from late-2022 cycle lows around 12%.
Bitcoin bull markets are typically characterized by a rise in dominance of “young” Bitcoins (i.e. coins being bought by new investors from HODLers), while Bitcoin bear markets are characterized by a rise in dominance in the percentage of coins that haven’t moved for some time. Referring to the recent bounce from lows, Glassnode states that “the depth of this inflection point is very much in line with historical precedence”.
Glassnode goes on to present a slightly more informative indicator called the Realized HODL Ratio. “This metric compares this balance of wealth held between between 1-week and 1y-2y old coins, producing a macro scale oscillator”, they explain, adding that “higher values indicate a disproportionate wealth held by new buyers and speculators” and “lower values indicate a disproportionate wealth held by long-term, higher conviction HODLers”.
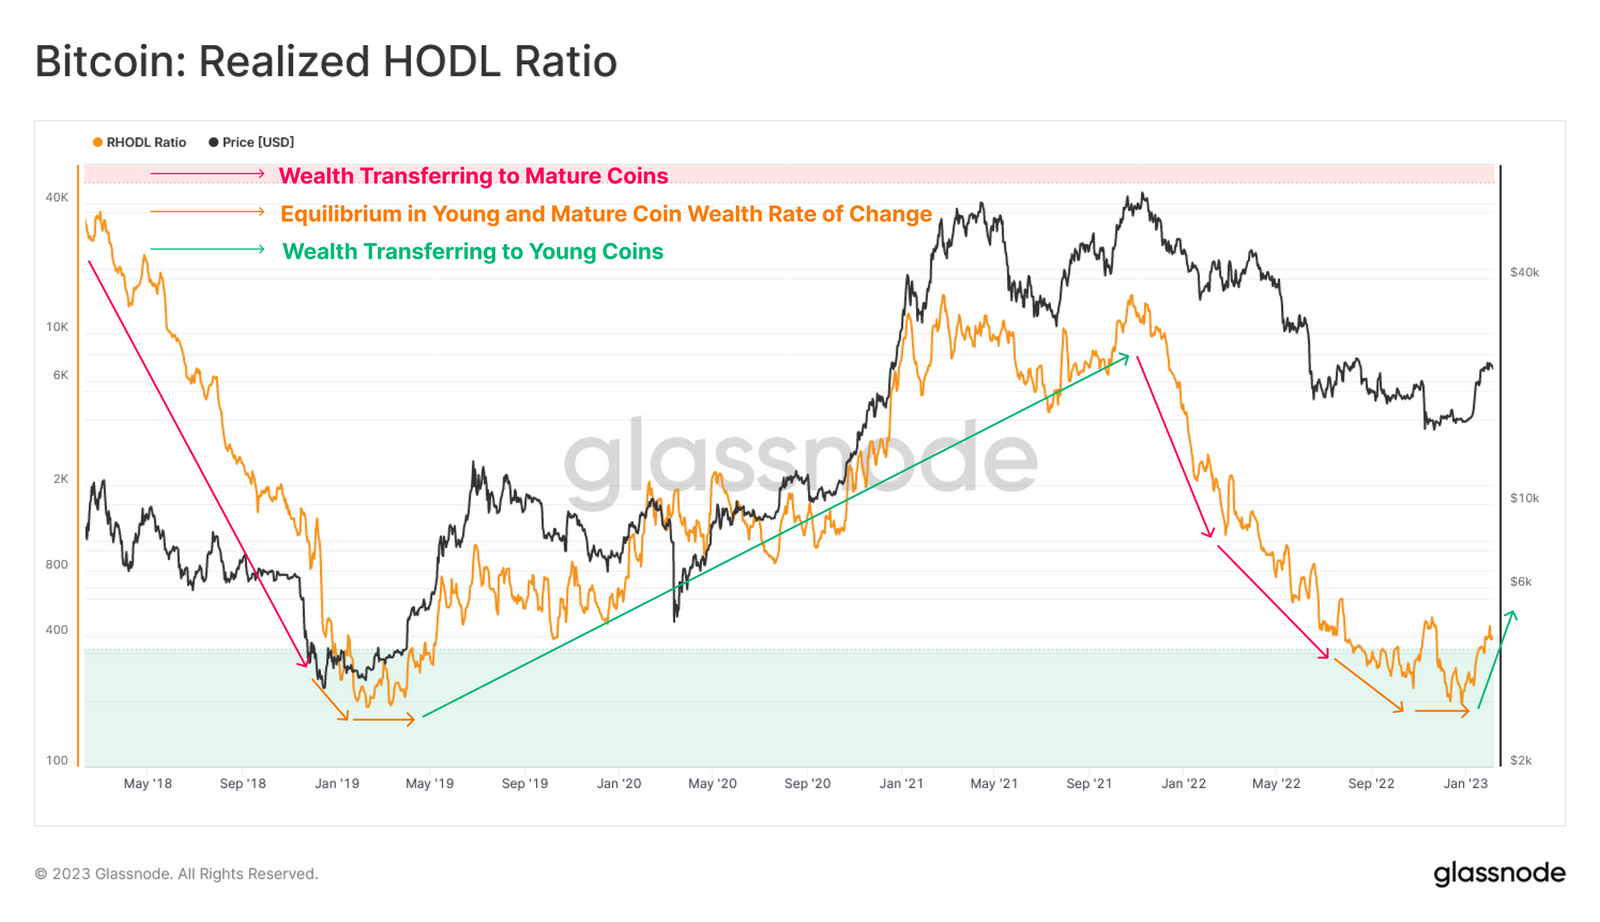
The crypto analytics firm observes that the Realized HODL Ratio is currently experiencing a bottom-forming pattern, indicating that there is a net transfer of wealth from HODLers to new investors.
“Signs of Full Detox of Exuberance” Mean Bear Market Might Be Over
In light of the above evidence that the Bitcoin market has returned to net profitability and that wealth may be starting to shift back to new investors from HODLers, Glassnode states that “there are signs that full detox of exuberance has taken place, and a cyclical transition may be underway”.
Indeed, as discussed in a separate article, seven out of eight technical and on-chain indicators tracked by analysts at crypto analytics firm Glassnode in their “Recovering from a Bitcoin Bear” dashboard are flashing that the bottom is in. Separately, another key on-chain indicator tracked by crypto analytics firm CryptoQuant called the Profit and Loss (PnL) Index just sent a definitive buy signal for the first time since 2019.
Positive on-chain and technical signs come as Bitcoin’s adoption by the broader population continues, with the number of non-zero balance wallet addresses likely to soon hit a new record high. Meanwhile, analysis of Bitcoin’s long-term market cycle, such as a recent thread from @CryptoHornHairs and according to Bitcoin’s stock-to-flow pricing model, suggest the cryptocurrency is probably in the early stages of a multi-year bull market.
[ad_2]
cryptonews.com


