[ad_1]

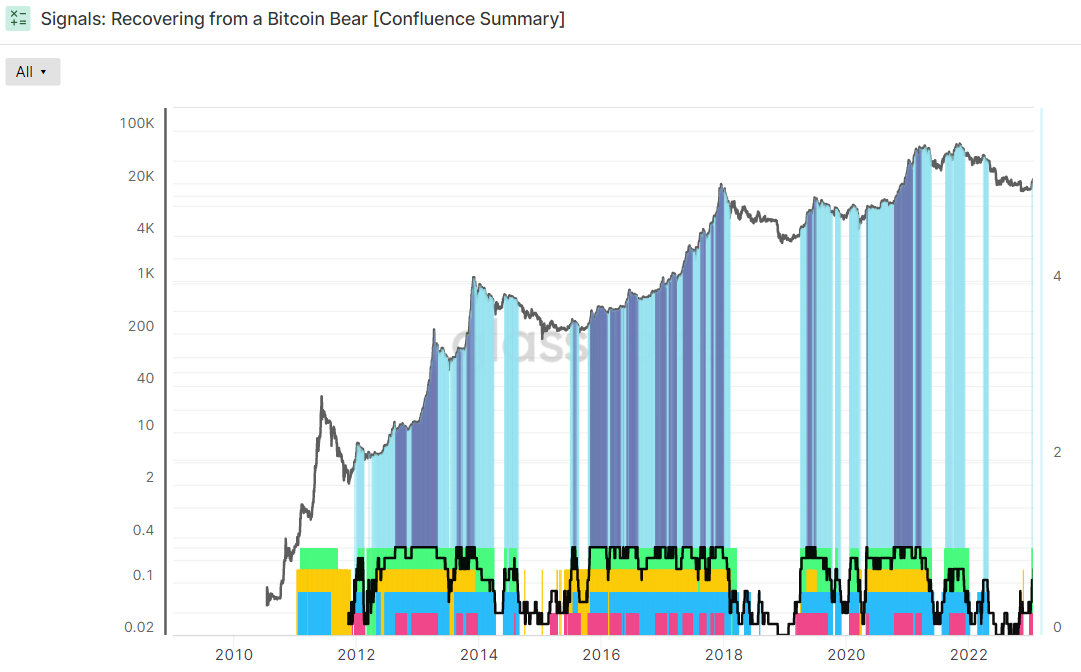
Six out of eight indicators watched by analysts at crypto data analytics platform Glassnode to identify when Bitcoin is transitioning out of a bear market are flashing bullish signals, and a seventh is likely to also soon turn green. Glassnode’s “Recovering from a Bitcoin Bear” dashboard of indicators seeks to help Bitcoin investors identify when the Bitcoin market is moving towards a healthier trend by watching a mixture of on-chain, technical and network fundamental indicators.
Historically, at least 5 of these indicators are flashing green when Bitcoin prices are rising. Meanwhile, when all eight indicators start flashing bullish signals, this has historically been a great buy signal. Conversely, when less than five of these indicators are flashing green, Bitcoin’s price is typically in a long-term decline. Light blue denotes time periods where at least five out of eight bullish conditions have been met. Dark blue denotes time periods when all eight are met.
Signal 1 and 2: Spot Prices Trading Above Key Pricing Models
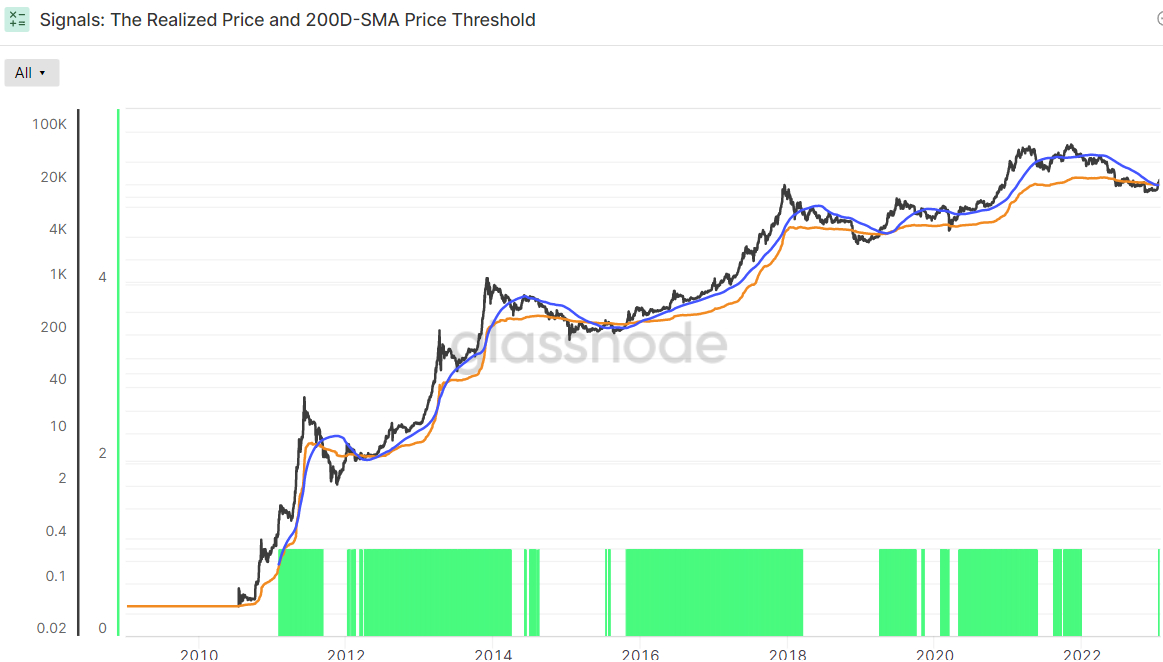
Glassnode groups these indicators into four categories. The first is whether or not Bitcoin is trading above key Pricing Models – the 200-Day Simple Moving Average (SMA) and the Realized Price, which is an on-chain indicator that shows the mean price of when each Bitcoin on the network last moved (the average price wallets “paid” for their Bitcoins when they received them).
With Bitcoin’s 200DMA at around $19,600 and its Realized Price at around $19,800, Bitcoin recently broke back to the north of both of these key levels for the first time since December 2021. Both are thus flashing green.
Signal 3 and 4: Network Utilization is Increasing
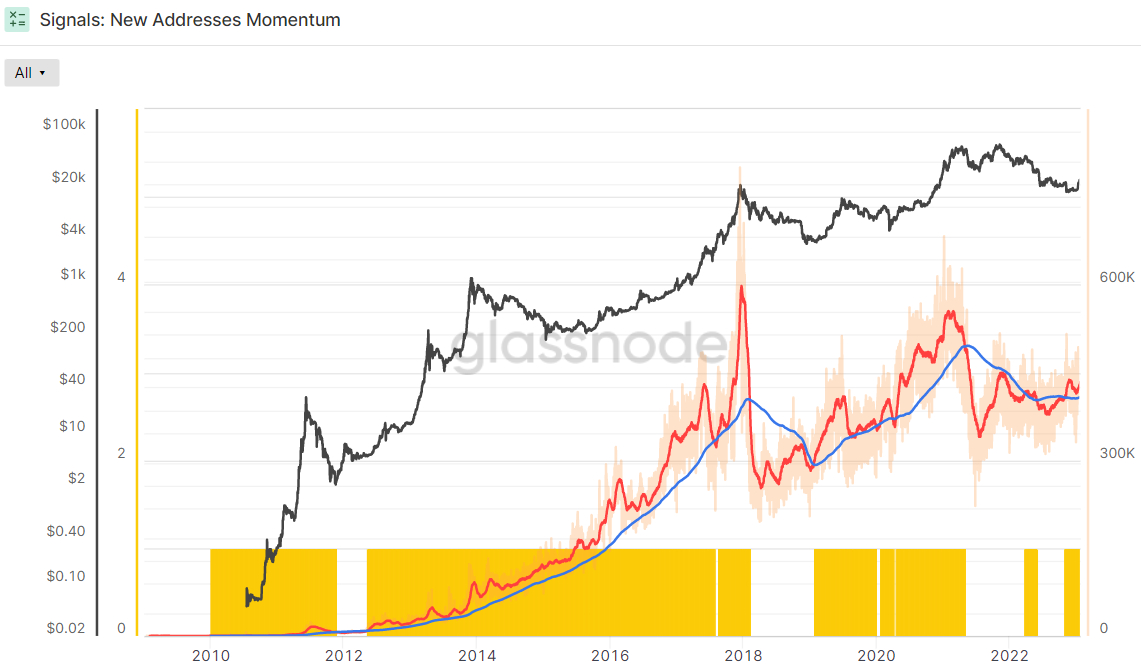
The 30-Day SMA of New Addresses recently broke above its 200-Day SMA and is thus flashing green. This has historically occurred at the start of bull markets.
Meanwhile, the Revenue From Fees Multiple still has a negative 2-year Z-score of around -0.33. The Z-score is the number of standard deviations above or below the mean of a data sample. In this instance, Glassnode’s Z-score is the number of standard deviations above or below the mean Bitcoin Fee Revenue of the last 2-years.
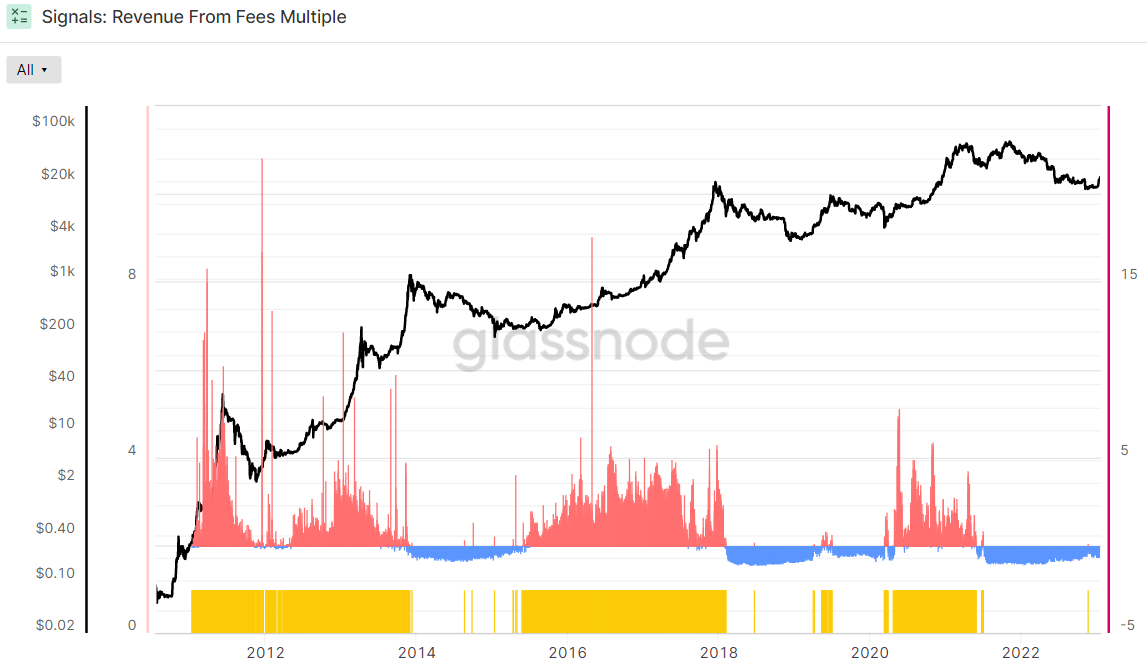
This indicator is thus still not flashing green. However, as history shows, this can change very quickly.
Signals 5 and 6: Market Profitability is Returning
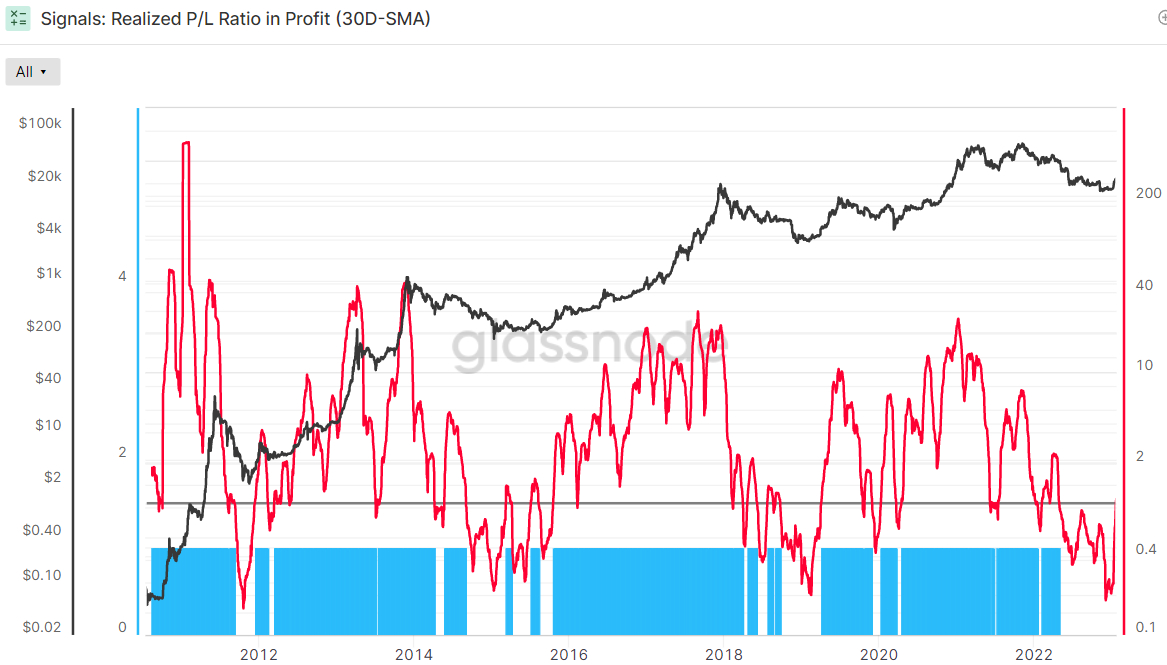
The 30-Day Simple Moving Average (SMA) of the Bitcoin Realized Profit-Loss Ratio (RPLR) indicator recently moved above one for the first time last April. That means that the Bitcoin market is realizing a greater proportion of profits (denominated in USD) than losses.
According to Glassnode, “this generally signifies that sellers with unrealized losses have been exhausted, and a healthier inflow of demand exists to absorb profit taking”. Hence, this indicator is sending a bullish sign.
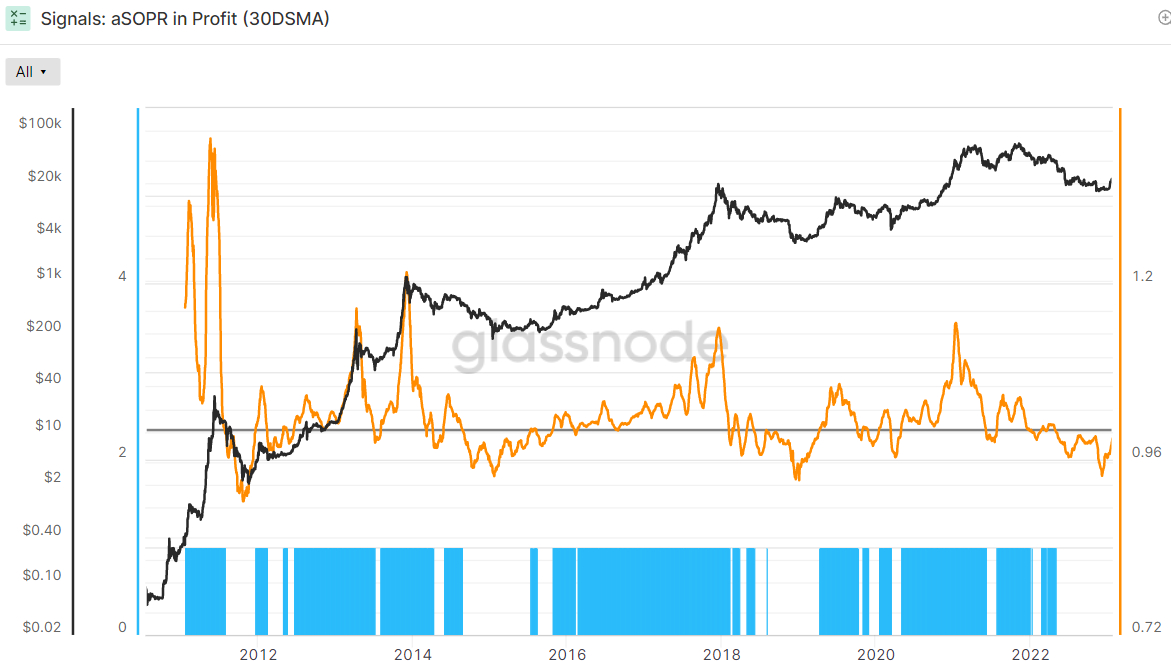
Meanwhile, though the Adjusted Spent Output Profit Ration (aSOPR), an indicator that reflects the degree of realized profit and loss for all coins moved on-chain, remains below 1 (indicating the market isn’t yet in profit), it is fast moving higher and looks likely to soon cross 1. It was last at 0.988.
This is the seventh indicator that isn’t yet sending a bullish signal, but soon likely will be. Looking back over the last eight years of Bitcoin history, the aSOPR rising above 1 after a prolonged spell below it has been a fantastic buy signal.
Signals 7 and 8: BTC Balance Has Moved In Favor of The HODLers
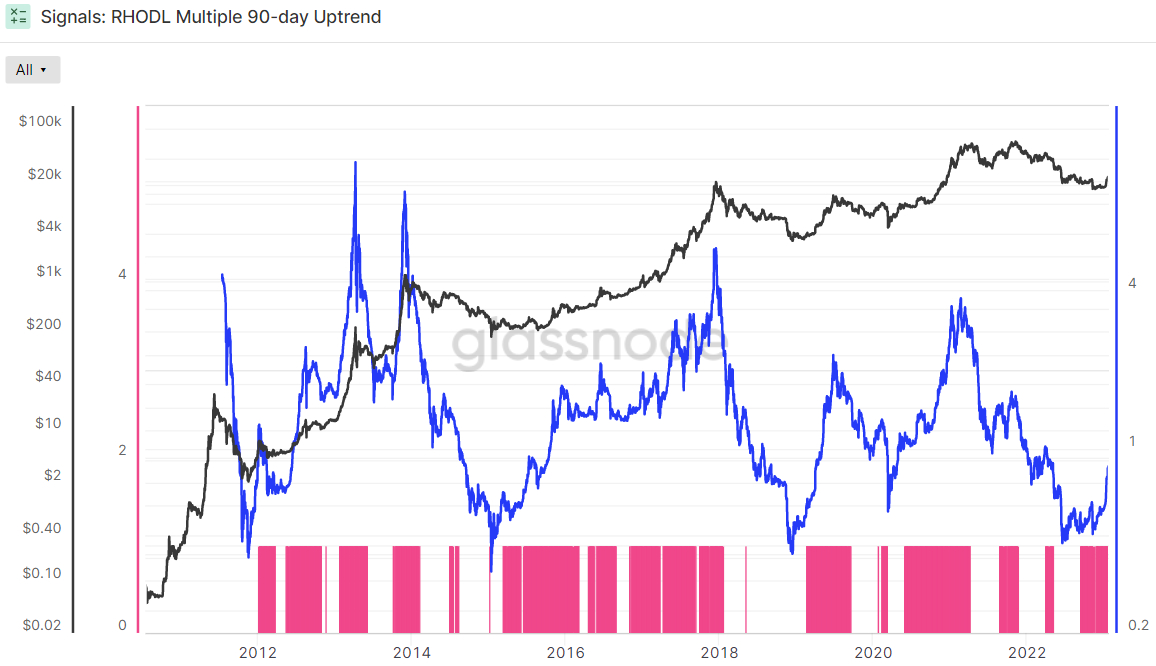
The Bitcoin Realized HODL Multiple has been in an uptrend over the last 90 days, a bullish sign according to Glassnode. The crypto analytics firm states that “when the RHODL Multiple transitions into an uptrend over a 90-day window, it indicates that USD-denominated wealth is starting to shift back towards new demand inflows”. It “indicates profits are being taken, the market is capable of absorbing them… (and) that longer-term holders are starting to spend coins” Glassnode states.
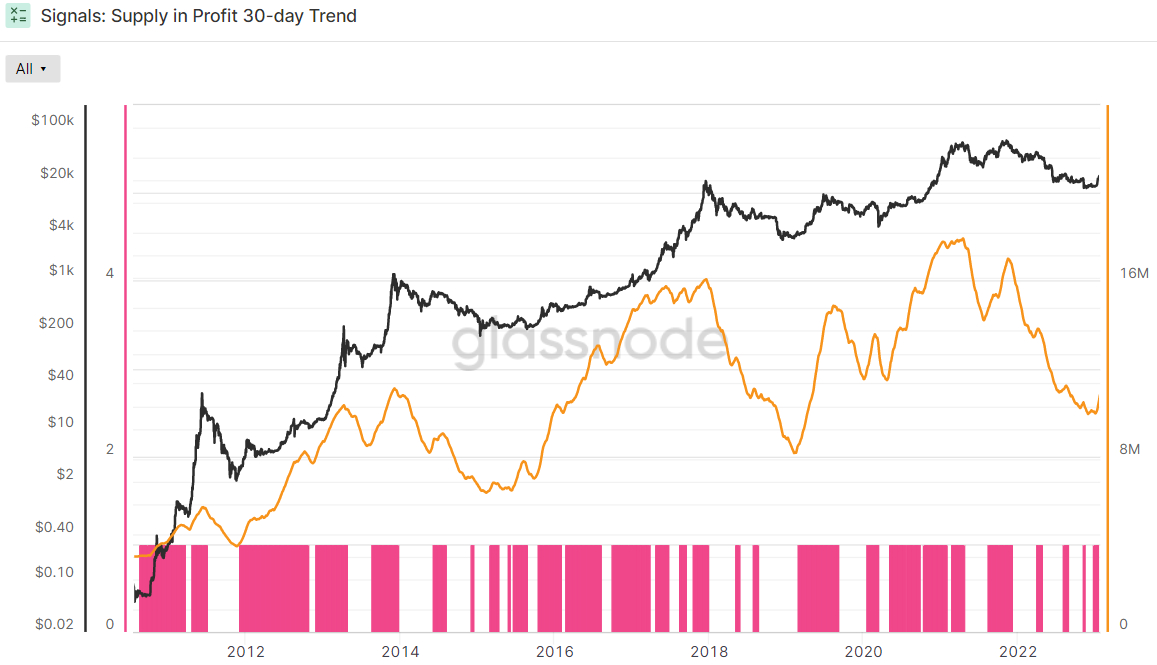
Glassnode’s final indicator in its Recovering from a Bitcoin Bear dashboard is whether or not the 90-day Exponential Moving Average (EMA) of Bitcoin Supply in Profit has been in an uptrend over the last 30 days or not. Supply in Profit is the number of Bitcoins that last moved when USD-denominated prices were lower than they are right now, implying they were bought for a lower price and the wallet is holding onto a paper profit. This indicator is also flashing green.
So Are We In A Bitcoin Bull Market?
2022’s macro headwinds appear to be abating. US inflation is fast dropping to more acceptable levels and with the US economy grinding to a halt as per recent survey data and corporate earnings, the bond market’s assessment that the Fed won’t be able to tighten rates much more in 2023 is looking like an increasingly accurate call.
This narrative has been a key driver of Bitcoin’s 2023 rally so far, and many think could further support its price in the months ahead. While some continue to deride the latest move higher as just another bear market rally, the above-noted indicators in Glassnode’s dashboard suggest that this latest move higher could well be something more.
And these aren’t the only on-chain indicators flashing signals of an incoming bull market. According to analysis posted on Twitter by @GameofTrade_, 6 on-chain metrics including the Accumulation trend score, Entity-adjusted dormancy flow, Reserve risk, Realized price, MVRV Z-score and Puell multiple are “calling for a generational long-term buying opportunity”.
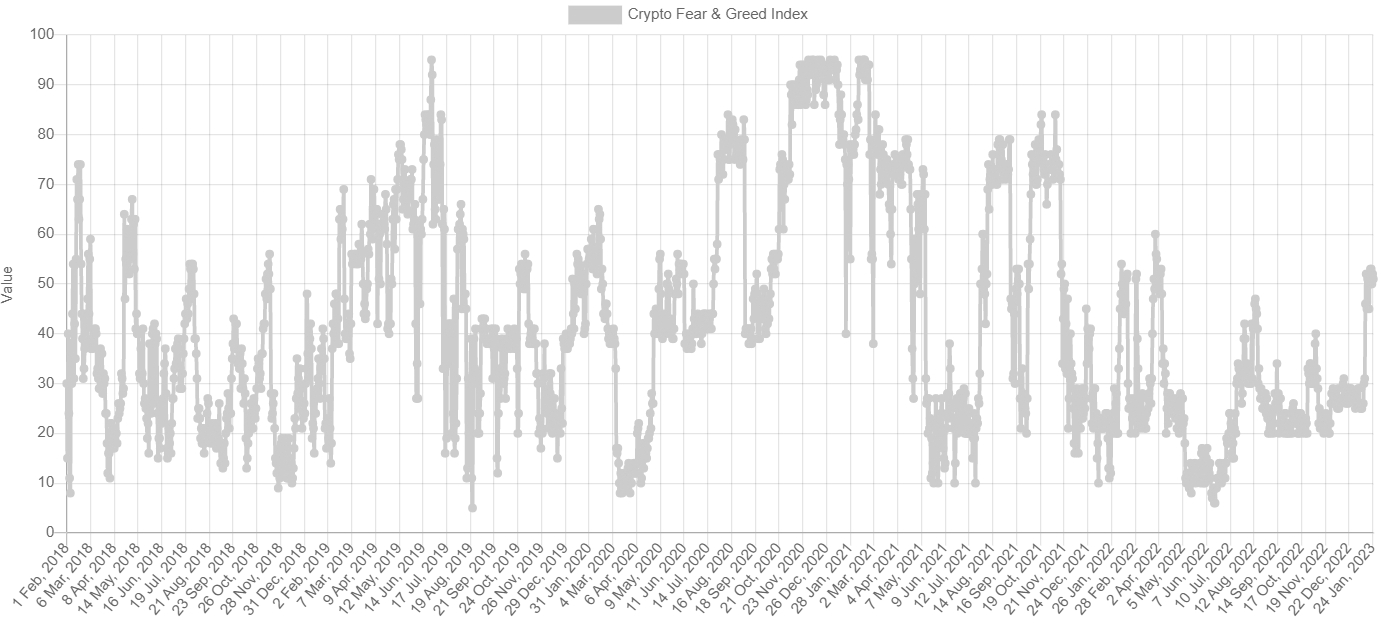
Elsewhere, the widely followed Bitcoin Fear & Greed Index recently moved back into neutral territory (i.e. above 50) for the first time after a prolonged spell of Fear and Extreme Fear. A lasting recovery back into neutral often comes at the beginning of the next Bitcoin bull market, such as in early 2019 and then again in mid-2020.
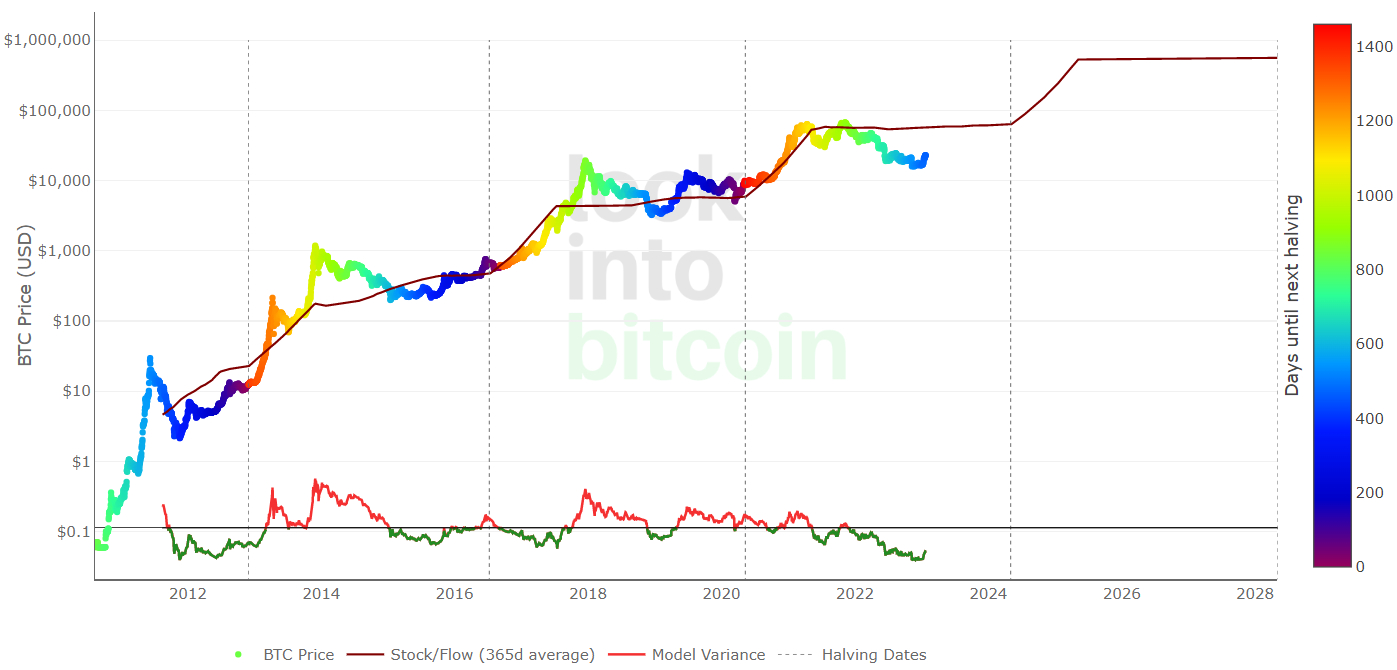
Analysis from crypto-focused Twitter account @CryptoHornHairs made a jaw-dropping observation that Bitcoin is following almost exactly in the footsteps of a near-four-year market cycle that it has been following for the past more than eight years. After bottoming last November, Bitcoin may rally for another nearly 1000 days, the analysis suggests, before entering its next bear market in 2025.
A widely followed Bitcoin pricing model is sending a similar story. According to the Bitcoin Stock-to-Flow pricing model, the Bitcoin market cycle is roughly four years, with prices typically bottoming somewhere close to the middle of the four-year gap between “halvings” – the Bitcoin halving is a four-yearly phenomenon where the mining reward gets halved, thus slowing the Bitcoin inflation rate. Past price history suggests that Bitcoin’s next big surge will come after the next halving in 2024.
[ad_2]
cryptonews.com


